Static ETA creates distrust
A fixed estimate stops reflecting reality once traffic, preparation or rider conditions change.
Product Specialist · Experimentation
A Wizard of Oz experiment to test whether contextual, dynamic ETA updates could reduce uncertainty and support a confident product investment decision.
01 · PRODUCT OPPORTUNITY
The product question was whether we could reduce perceived uncertainty without changing delivery speed — simply by making estimated arrival time more transparent and responsive to reality.
A fixed estimate stops reflecting reality once traffic, preparation or rider conditions change.
A real-time ETA engine requires technical investment before the team knows whether the experience creates enough value.
Simulate the proposition manually and let evidence determine whether the next investment is justified.
We believe dynamically updating ETA during the journey will reduce user uncertainty. We will know we are successful if delay-related complaints decrease by 25%.
02 · EXPERIENCE CONTEXT
Before the ETA could change, the user needed a believable end-to-end experience. The prototype established context from order confirmation through rider assignment and pickup.
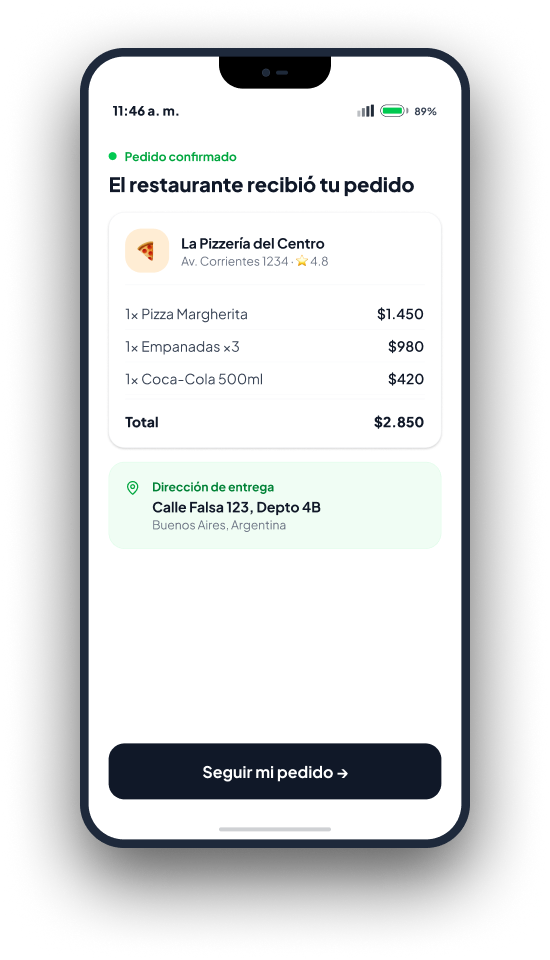
The journey starts with a clear confirmation and a direct path to tracking.
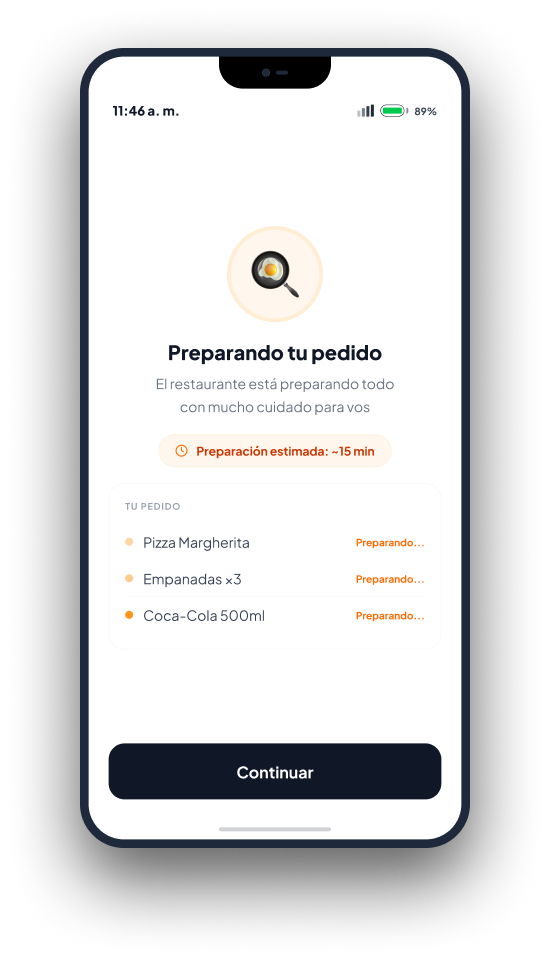
The user can understand progress before the rider begins the delivery.
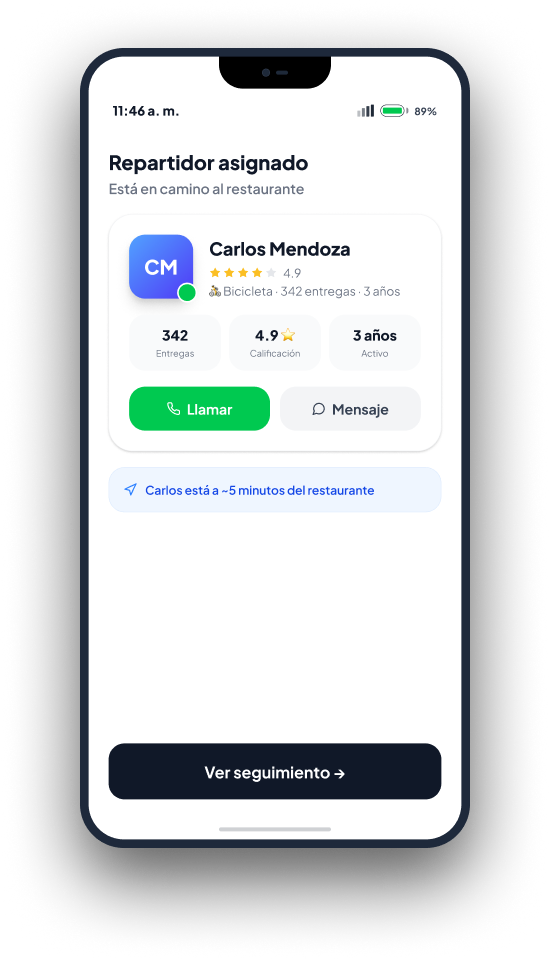
Introducing the rider makes the transition into active tracking feel real and trustworthy.
03 · WIZARD OF OZ STRATEGY
A background operator monitored active orders and manually changed the ETA when real-world conditions made the original promise unrealistic — simulating automation without first building it.
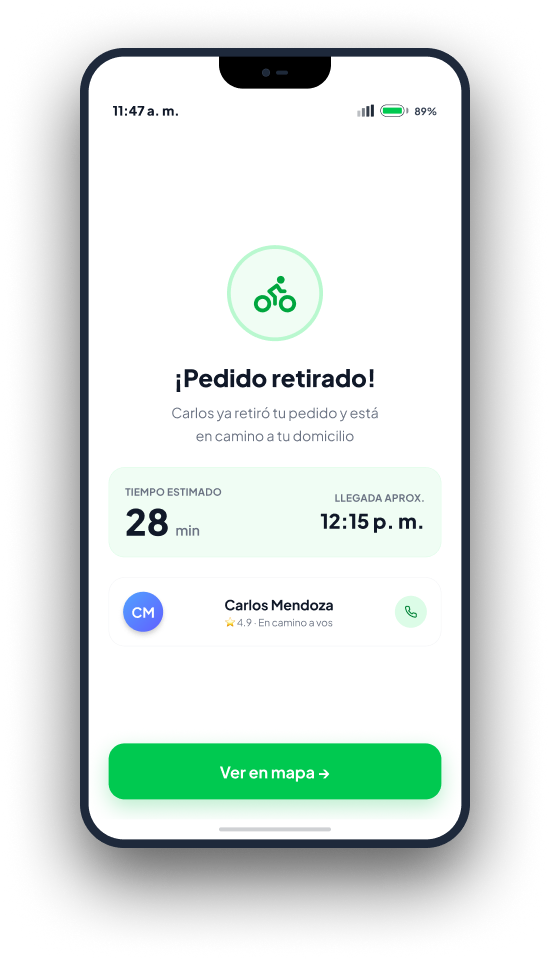
Once the rider has the order, the initial live ETA becomes the baseline for the experiment.
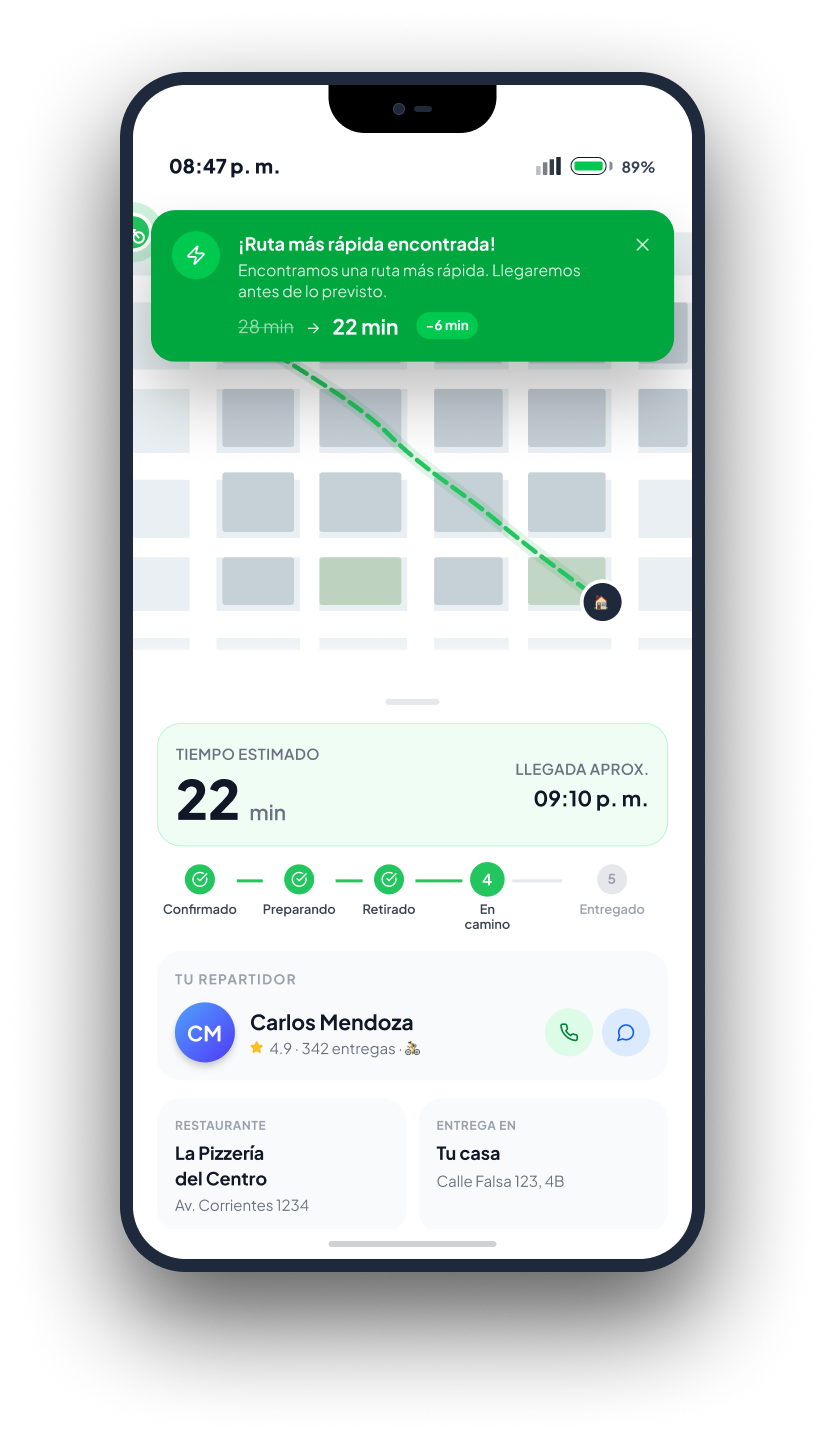
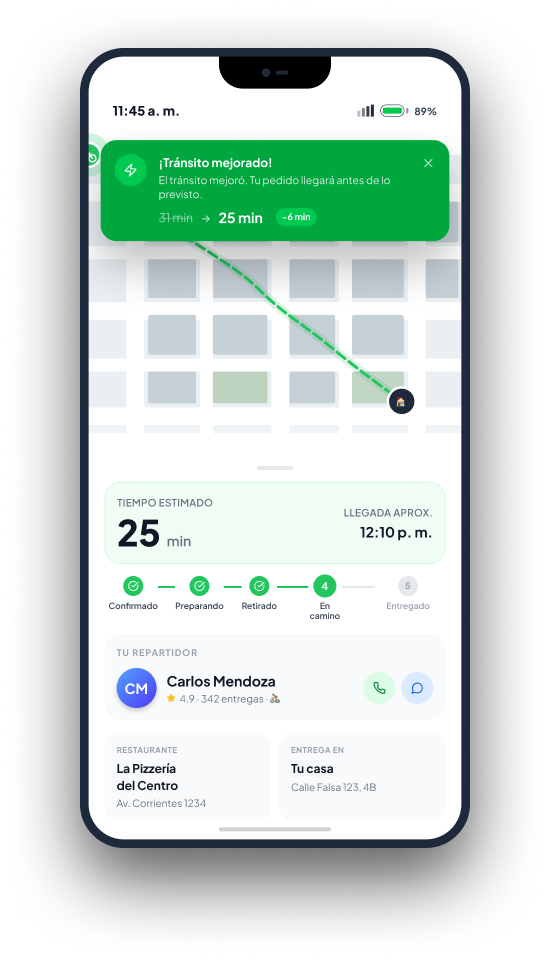
A faster route reduces the ETA and gives the user a proactive explanation.
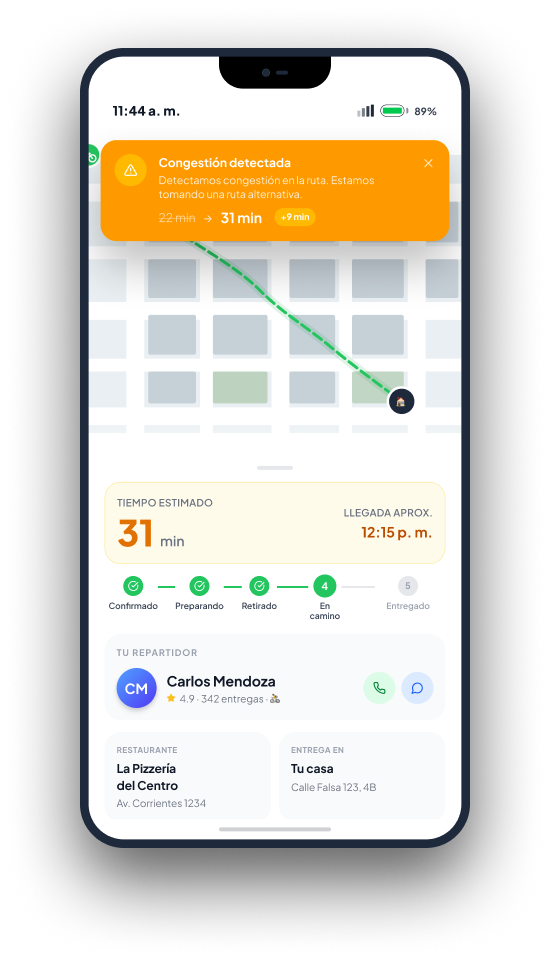
When congestion increases the ETA, the experience explains why the promise changed.
04 · DYNAMIC ETA EXPERIENCE
The strongest product insight was that the experience could not be reduced to a changing number. Context made the change understandable.
Communicate positive changes too. This reinforces that the system is actively following the journey.
When the estimate worsens, explain the cause instead of silently extending the wait.
Recalculate again when conditions recover, showing that the ETA remains dynamic rather than fixed.
05 · INTERACTIVE PROTOTYPE
The navigable prototype lets you move through the flow and see how the ETA changes are communicated in context.
If the embedded prototype is blocked by the browser, open it directly here ↗.
06 · CLOSING THE LOOP
The experiment continued through delivery and feedback so behavioral signals could be connected with perceived clarity, confidence and satisfaction.
The user receives one more recalculation when the journey becomes more favorable.
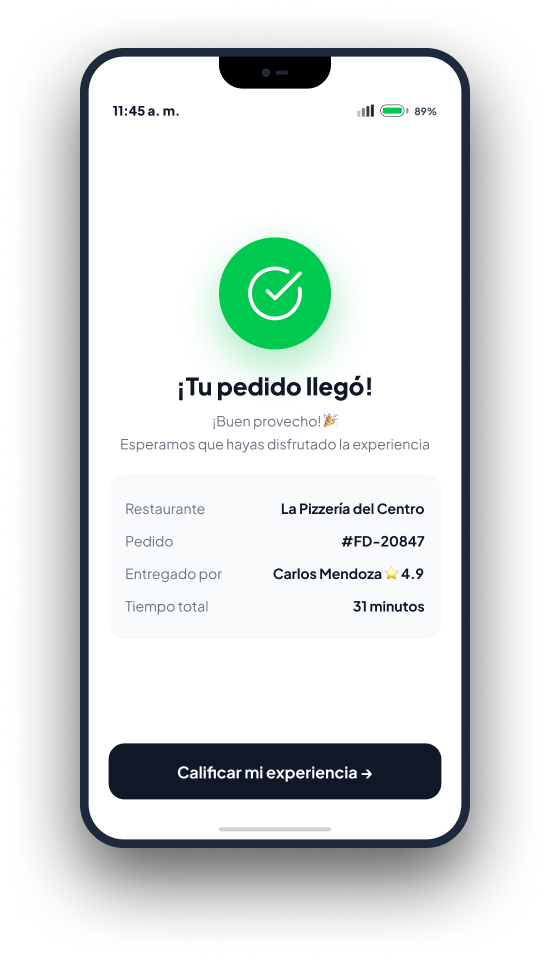
The operational journey closes with a clear summary of the completed order.
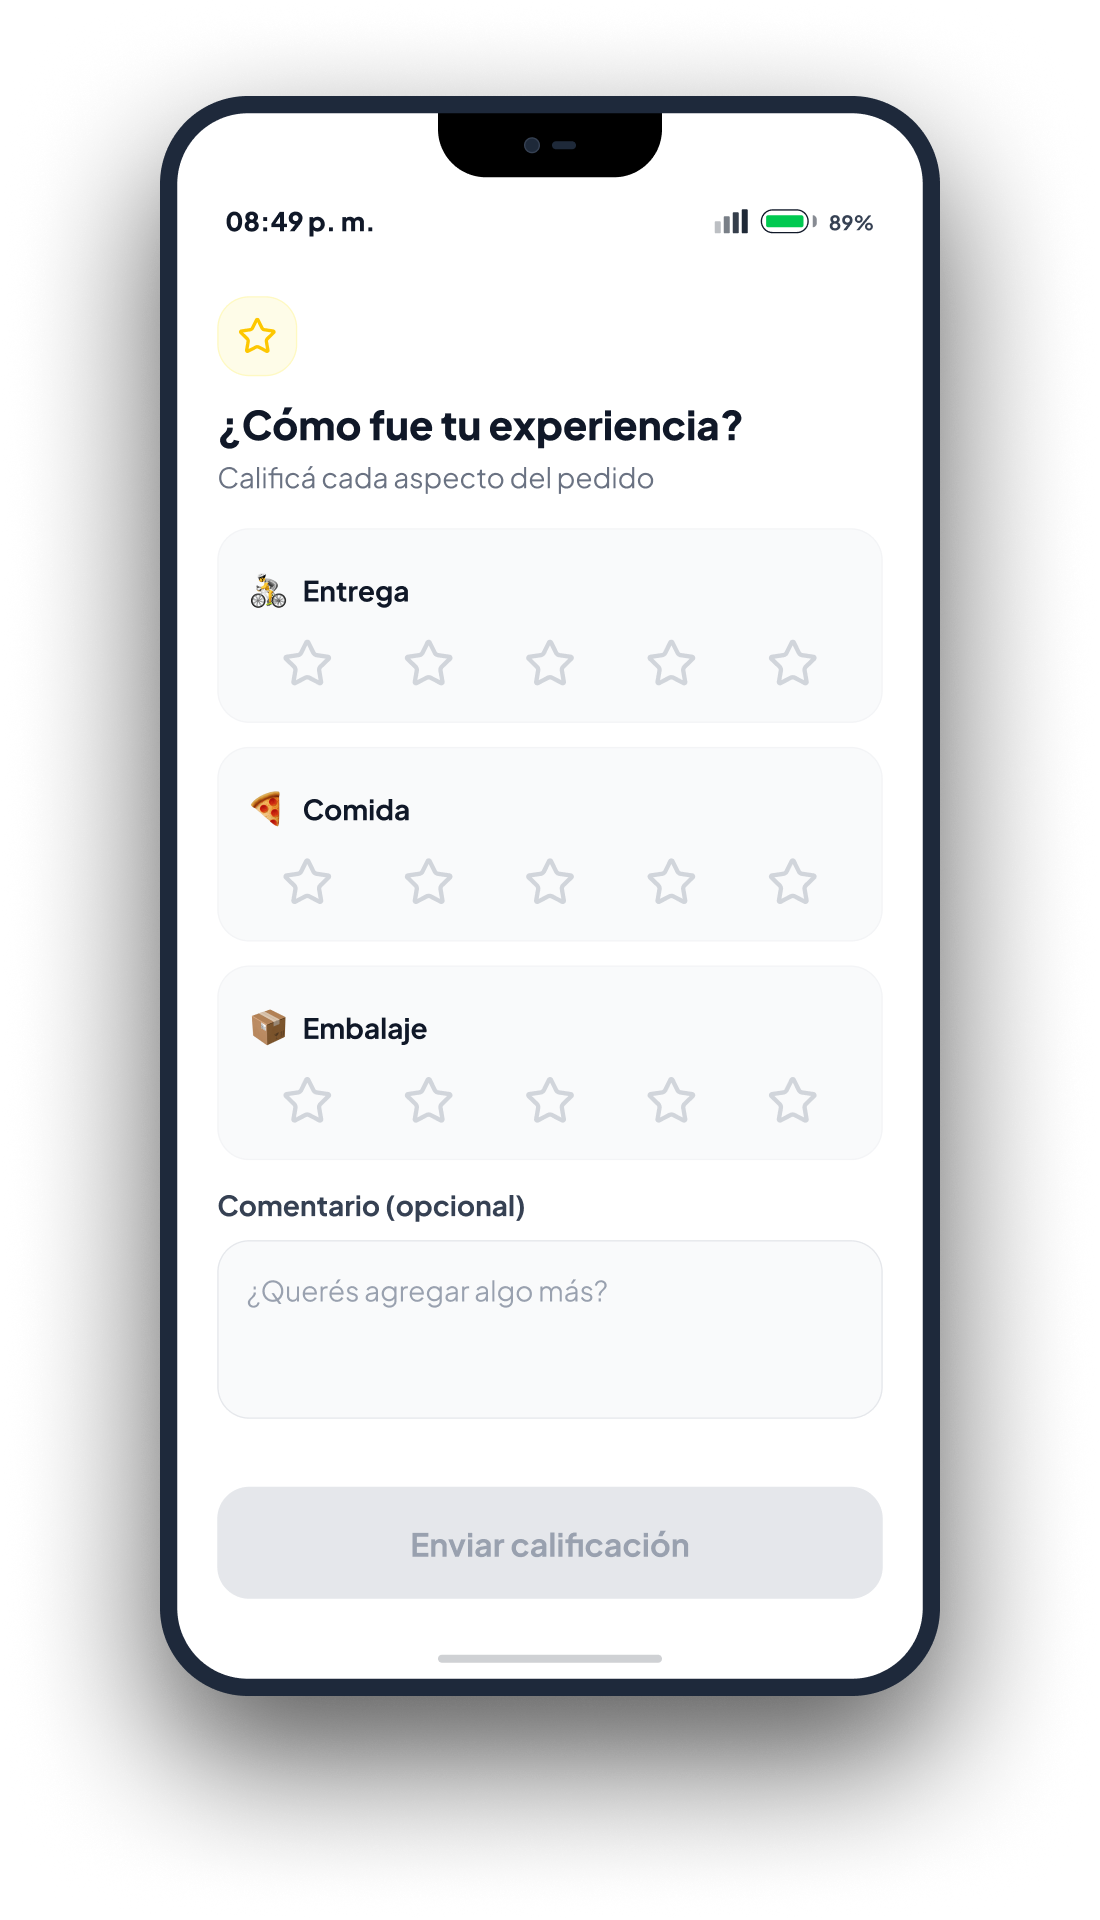
The final survey captures clarity, reassurance and overall satisfaction after the complete experience.
07 · MEASUREMENT FRAMEWORK
Complaint reduction was the primary success criterion, supported by behavioral and perception metrics that could explain why the experience worked — or failed.
Primary hypothesis threshold.
Fewer “Where is my order?” questions.
Users should better understand what is happening during the journey.
Measured after delivery.
08 · SIMULATED RESULTS
The simulated one-week experiment produced promising directional evidence. These are experiment results, not production metrics.
Exceeded the 25% hypothesis threshold.
Reduced “Where is my order?” contacts.
Participants found the information clear or very clear.
Participants felt calmer with contextual ETA explanations.
09 · PRODUCT LEARNINGS
Messages such as “Traffic detected” or “We found a faster route” provided more reassurance than a silent numerical change.
Transparency can improve the waiting experience even without increasing delivery speed.
The assumption that changing only the ETA would be sufficient was rejected; explanation was part of the product value.
Update frequency, message type, ETA precision, personalization and repurchase impact became the next research questions.